

Beat 1.4%: Measurement First Shopify Conversion Rate Benchmarks
The top 10% of stores push past 4.7%, according to Littledata’s Shopify-specific benchmarks. Before you judge your own number against any of this, break it down by channel, device and average order value: a blended rate hides more than it reveals. Start in Shopify Analytics under Reports, filtered by channel and device.
TL;DR:
- Segmentation by channel, device, and product category is essential because conversion rates vary widely across these dimensions, often by a factor of two or more.
- Mobile traffic typically converts at a lower rate than desktop, so optimizing mobile UX can significantly impact overall performance, especially since most traffic is mobile.
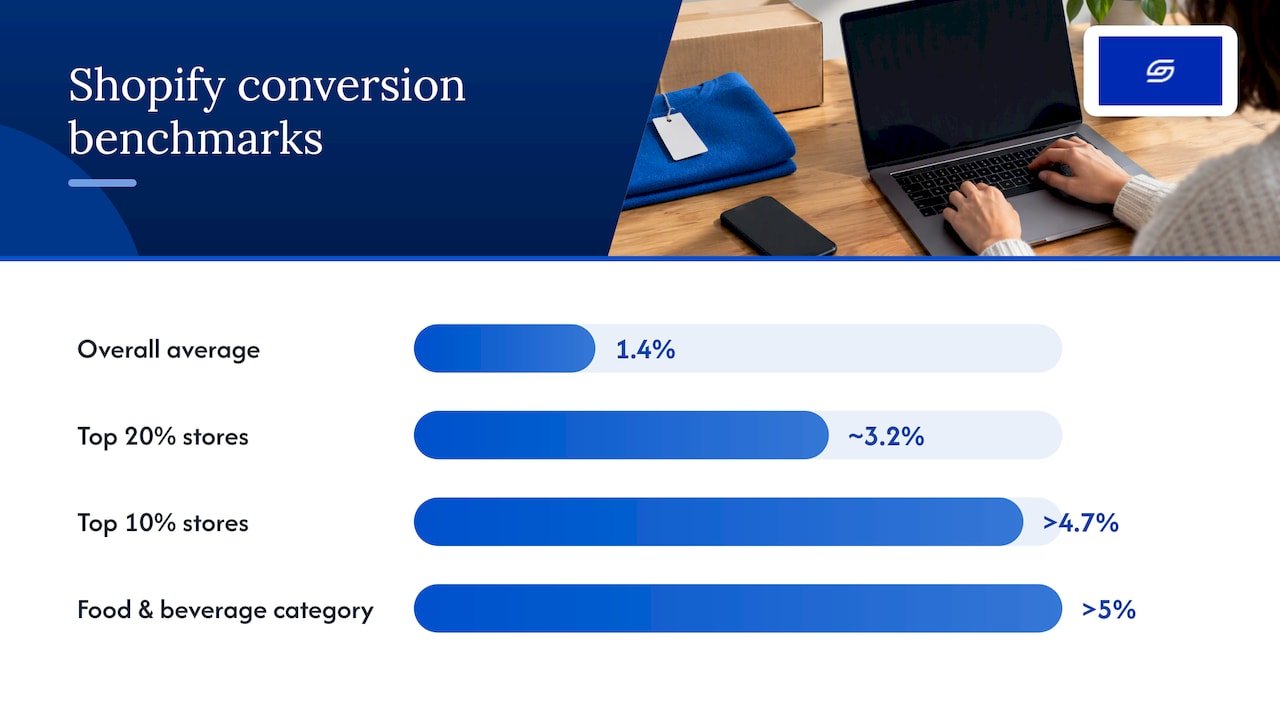
- Benchmark averages tend to be around 1.4% for Shopify stores, with the top 10% exceeding 4.7%, but high conversion rates in specific segments may not reflect overall store performance.
- Accurate measurement is crucial; reconcile Shopify’s session-based data with ad platform reports and ensure time periods align to get a true picture of performance.
- Prioritize fixes in measurement accuracy, page speed, and checkout simplification before considering store redesigns, as small, tested improvements usually outperform major overhauls.
Table of Contents
- How Shopify calculates conversion rate and which metric to benchmark
- Current Shopify benchmark ranges across industries and devices
- Why blended averages mislead and how to segment your own numbers
- Where to look in your funnel and the most common conversion bottlenecks
- Practical, prioritised tactics to lift your Shopify conversion rate
- How a practitioner benchmarks and optimises conversion
- Author perspective: priorities for Shopify owners in 2026
- How Soodo can help you benchmark and improve conversion
- Selected benchmark reports and Shopify documentation
- Sources
- FAQ
How Shopify calculates conversion rate and which metric to benchmark
Shopify’s formula is simple: divide the number of purchases by the number of sessions, then multiply by 100. Shopify’s own guidance gives the example of 25 purchases from 1,000 sessions, which works out to 2.5%. That’s the number sitting in your Analytics dashboard under Reports, labelled as online store conversion rate, and it’s the figure most benchmark reports are built around.
A session isn’t quite the same as a visitor. Shopify counts a session as active browsing activity that ends after 30 minutes of inactivity, and all sessions reset at midnight UTC regardless of where your customers are shopping from. That matters for benchmarking because a single shopper browsing late at night, pausing, then returning after the UTC cutover could register as two sessions rather than one. It rarely moves the needle much at scale, but it’s worth knowing when your numbers look slightly off from a gut-feel estimate.
This sessions-based approach differs from visitor-based conversion metrics you might see in Google Analytics 4, which tracks ecommerce conversion against users or events rather than Shopify-defined sessions. The two numbers won’t match exactly, and that’s fine as long as you’re consistent about which one you’re using when you compare yourself to a published benchmark.
A few practical points worth keeping in mind:
- Always check whether a benchmark report is sessions-based (Shopify-style) or visitor-based (GA4-style) before comparing it to your own number.
- Pull your rate from Analytics > Reports > Online store conversion rate for the cleanest apples-to-apples read.
- Match the time window: comparing a 30-day Shopify rate to a quarterly industry average will skew your read, especially around sales events.
Get this alignment right first. Everything else in this guide, from industry benchmarks to funnel triage, depends on you reading the correct number off your own dashboard.
Current Shopify benchmark ranges across industries and devices
Averages are a starting point, not a verdict. Littledata’s analysis of Shopify stores puts the average Shopify conversion rate at around 1.4%, with the top 20% of stores clearing roughly 3.2% and the top 10% exceeding 4.7%. Broader ecommerce snapshots tell a similar story: Statista’s global data places overall online shopper conversion in a range from around 1.6% to 2.9% depending on the quarter and methodology, which is a useful reminder that no two benchmark sources measure things identically.
Industry matters more than most store owners expect. Shopify’s own 2026 commentary notes that conversion rates vary enormously by category, from under 1% in luxury goods to over 5% in food and beverage. Here’s roughly how that spread tends to play out:
- Food and beverage: often above 5%, driven by low prices, frequent repeat purchases and minimal consideration time.
- Beauty: typically mid-range, benefiting from habitual repurchase but still requiring some trust-building for new customers.
- Apparel: wide variance depending on price point and return policy clarity, with fast fashion usually converting higher than premium labels.
- Home goods: moderate conversion, often slowed by higher average order values and longer research periods.
- Luxury: frequently under 1%, since high-ticket purchases involve longer deliberation, multiple sessions and often a different conversion path altogether, including phone or in-person sales.
Shopify’s guidance is explicit on this point: a lower rate can be entirely rational for high-priced goods, and a higher rate often just reflects low-cost, repeat-purchase products rather than superior execution. Readers outside the markets these reports cover, particularly across the Asia-Pacific region, should treat these figures as directional rather than exact, since most published benchmarks skew towards North American and European traffic.
Device is the other major fault line. Littledata’s device-level data shows mobile traffic usually makes up the majority of sessions for most stores but converts at a noticeably lower rate than desktop. Desktop shoppers tend to be further along in their decision, often returning to complete a purchase they researched on mobile, and that shows up clearly at the top end: desktop’s top-decile conversion rate can run well ahead of mobile’s equivalent. Smart Insights frames this usefully: a mobile gap usually signals a mobile UX or traffic-quality issue rather than a failing store overall, which is a far more useful diagnosis than simply concluding you’re “underperforming.”
The real question is what’s happening underneath that number by channel, device and product category, and that’s where the next section comes in.
Why blended averages mislead and how to segment your own numbers
A single conversion rate number flattens a lot of very different buying behaviour into one figure, and that’s exactly why it misleads. Shopify’s guidance is blunt about this: traffic source and device both swing conversion dramatically, and comparing yourself to an industry average without segmenting is a bit like judging a restaurant’s success by averaging the bill size across breakfast, lunch and a wedding reception.
Channel is the first place this shows up. Representative ranges from benchmark reports suggest email traffic often converts around 5% or higher, since subscribers are already warmed up. Referral traffic varies the most, depending heavily on the quality and relevance of the referring site.
Average order value changes the picture again. A £15 skincare refill and a £400 jacket don’t convert at the same rate, and they shouldn’t. Lower-priced, repeat-purchase items typically see higher conversion because the decision requires less deliberation and often happens on autopilot once trust is established. Higher AOV items naturally see more browsing, comparison and cart abandonment before a purchase, which is a buying pattern rather than a site failure.
Before you benchmark anything, report your conversion rate across these four segments at minimum:
- Channel: email, organic search, paid search, paid social and referral, each pulled separately.
- Device: mobile versus desktop, since the gap between them tells you where your UX problems live.
- Product category: especially if you sell across a wide price range, since blending a £20 item with a £300 item hides the real story.
- New versus returning customers: returning customers typically convert several times higher than first-time visitors, and blending the two disguises how well your acquisition funnel is actually working.
Once you’ve got these four cuts, your blended average becomes far less important than the pattern underneath it. A store with a mediocre blended rate but strong email and returning-customer numbers has a very different problem to solve than one with weak numbers across every segment.
Where to look in your funnel and the most common conversion bottlenecks
Once you’ve segmented your traffic, the next step is finding exactly where shoppers drop off. Four micro-metrics tell you most of what you need to know: product-page conversion, add-to-cart rate, checkout-initiation rate and checkout-completion rate. Each one points to a different kind of problem.
A low product-page conversion rate usually means the page itself isn’t doing its job, whether that’s unclear pricing, thin product information or a slow load time. A healthy add-to-cart rate followed by a weak checkout-initiation rate often points to pricing shock, such as shipping costs appearing for the first time at checkout. And a strong checkout-initiation rate that dies before completion is almost always a payment, form-friction or trust problem.
Some of the most frequent culprits worth checking first:
- Page speed, particularly on mobile, where every extra second of load time chips away at patience.
- Missing payment methods, especially local options shoppers expect and don’t find at the final step.
- Surprise shipping costs that appear only once a shopper reaches checkout.
- Excessive form fields that ask for more information than the purchase actually requires.
- App bloat, where unused or redundant apps slow pages without adding value.
- Tracking leaks, where conversions happen but aren’t recorded, making the problem look worse than it is.
Pro Tip: Run a mobile checkout test on your own phone, using your actual payment method, before you touch anything else. Most funnel problems reveal themselves in the first two minutes of trying to buy from your own store.
Over the next 24 to 72 hours, a useful triage sequence looks like this: run a mobile and desktop speed test, complete a full checkout on both devices using a real card and a digital wallet, confirm every advertised payment method actually works, and audit your installed apps for anything that’s slowing pages without earning its place. This short exercise usually surfaces two or three fixable issues before you touch a single line of design.
Practical, prioritised tactics to lift your Shopify conversion rate
Fixing conversion rate works best in a specific order: measurement first, then speed and user experience, then checkout, then ongoing testing. Skipping straight to redesigns before your tracking is trustworthy means you’ll be optimising against numbers that might already be wrong.
- Fix your measurement before anything else. Client-side tracking frequently undercounts conversions, particularly for paid channels. Littledata’s analysis describes a case where server-side tracking recorded four to five times more Microsoft Ads conversions than the free tracking app had captured, which means decisions based on the undercounted number would have been badly wrong. Reconcile your Shopify order data against what your ad platforms report before you trust either number on its own.
- Cut page weight and app bloat. The same Littledata research found that many stores run far more installed apps than they actively use, and each one adds page weight and maintenance overhead. Compress images, load critical CSS first, and remove any app that isn’t earning its keep, with particular attention to your mobile layout since that’s where most of your traffic and most of your lost conversions live.
- Simplify checkout and payments. Reduce the number of form fields to the minimum needed to complete an order, offer accelerated options like Shop Pay, and make sure local payment methods shoppers expect are actually available. Shipping and returns information should be visible before checkout, not revealed as a surprise at the final step, since that’s one of the fastest ways to lose a shopper who was ready to buy.
- Test by hypothesis, not by hunch. Prioritise test ideas that touch your highest-traffic funnel points, typically the product page and checkout, and segment results by channel and device so a win on desktop doesn’t mask a loss on mobile. Measure the outcome in actual revenue impact rather than percentage change alone: a 0.3 percentage point lift sounds small until you calculate what it’s worth across a month of traffic.
Pro Tip: Before launching any test, write down what you’ll do differently if it wins, loses, or shows no clear result. A surprising number of tests get run and then ignored because nobody decided in advance what “success” would mean.
This order matters because each step compounds the one before it. Clean measurement means your speed and UX fixes get judged accurately. A faster, clearer store gives your checkout improvements a fair shot. And a smooth checkout means your testing programme is measuring real buying decisions rather than fighting friction you could have removed first. For a deeper walkthrough of these tactics, Soodo’s guide to CRO strategies covers implementation detail beyond what fits here, and the eCommerce conversion tracking primer is a useful next stop if your measurement needs the most work.
How a practitioner benchmarks and optimises conversion
A useful diagnostic follows a consistent sequence: audit the analytics to find where segmented conversion is genuinely weak, prioritise the quickest wins against that list, run iterative tests to confirm what actually moves the number, then scale whatever wins across the rest of the store. This founder-led approach is built on direct operator experience rather than templated recommendations.
A typical diagnostic engagement looks at:
- Segmented conversion data across channel, device and product category to find the real problem, not the apparent one.
- Checkout and payment friction, since that’s consistently one of the highest-leverage areas to fix.
- Page speed and app load, which affect every other metric downstream.
- A prioritised list of quick wins, often including checkout simplification and speed improvements, ranked by expected impact rather than ease of implementation alone.
The goal of this kind of audit isn’t a long list of generic suggestions. It’s a short, ranked set of fixes that map directly to where your segmented data shows the drop-off actually happening.
Author perspective: priorities for Shopify owners in 2026
If you take one thing from this guide, let it be this: measurement and segmentation come before any redesign. A blended conversion rate tells you almost nothing on its own, and chasing it as a single number leads store owners to redesign things that were never broken while ignoring a checkout that’s quietly leaking sales. Fix tracking first, segment by channel and device second, and only then decide whether you’ve got a UX problem or a measurement illusion. Small, tested fixes to checkout, payments and speed consistently beat a full redesign built on a hunch.
— Soodo
How Soodo can help you benchmark and improve conversion
Knowing your number is good and good is different from knowing exactly which three changes would move it. That’s the gap Soodo closes for Shopify store owners who’d rather have a founder-led team diagnose and fix the problem than spend another month guessing.
Soodo’s relevant services for readers working through this guide include:
- Existing Shopify Store Optimization services, for stores that need a focused conversion audit and prioritised fixes rather than a full rebuild.
- New Shopify Website Development services, for stores where the underlying structure is holding conversion back and a CRO-focused rebuild makes more sense than patching.
- 1-1 Training and consulting options, for founders who want to run the audit and testing process themselves with direct guidance.
A typical optimisation engagement starts with the same segmented audit described above and ends with a ranked quick-win list, often covering checkout friction and page speed, plus a testing roadmap you can run with or hand to your team. If you’d rather have someone else find the leak and fix it, get in touch about existing store optimisation and we’ll tell you honestly whether a quick fix or a rebuild makes more sense for where you are.
Selected benchmark reports and Shopify documentation
For calculation methodology, see Shopify’s own guide. For Shopify-specific deciles, see Littledata. For global reference points, see Statista. Segment your own data before trusting any of them outright, and treat regional figures as directional if you trade outside the markets they were measured in.
Sources
FAQ
What is a good conversion rate for Shopify?
Littledata’s benchmarking puts the average Shopify store closer to 1.4%, so hitting 2% or more already puts you ahead of a typical store. Always check this against your own industry and device split before deciding whether your number is actually a problem.
Is 2.5% a good conversion rate?
Yes, 2.5% is comfortably above the typical Shopify average of around 1.4% reported by Littledata, and it sits within the range most stores would call good.
Is a 12% conversion rate on a website good?
A conversion rate well beyond the top-decile threshold of roughly 4.7% that Littledata reports for Shopify stores would be exceptional for a typical ecommerce store. Rates that high usually show up on segmented metrics, such as email traffic or returning-customer checkout rates, rather than as a blended, store-wide figure, so check which metric you’re actually looking at.
Is a 50% conversion rate good?
Metrics like checkout-completion rate among shoppers who already started checkout, or add-to-cart rate for a highly targeted email send, can realistically reach that level, so confirm which stage of the funnel the number describes before comparing it to the overall benchmarks in this guide.
Recommended

Jessica Bong
Jessica Bong is the founder of Soodo, a Singapore Shopify agency that builds, revamps and migrates Shopify stores, with every store set up to be found in AI search (GEO). She has spent over 10 years in ecommerce and runs her own Shopify brand, Patch&Bagel, where every Soodo technique is tested first. Jessica is also a WSQ-certified Shopify trainer at Equinet Academy.